Networks and Data Overview
In all, there are well over 2.3 million data elements captured in 44 data tables. The data can be made available in postgresql format and json-ld courtesy of project with the Australian Research Data Commons.
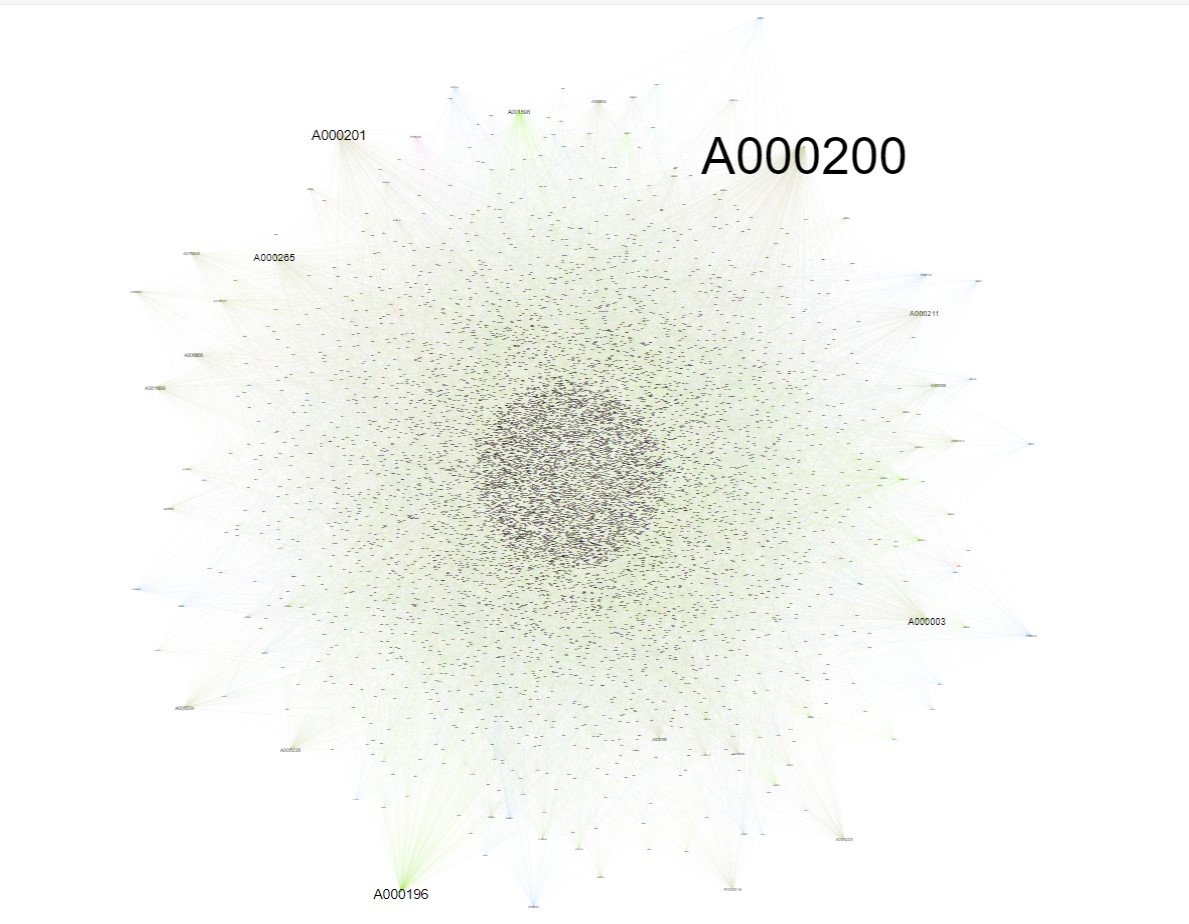
The network graph below shows the links between entities as they were in the 2024 May Edition. The graph was created using Gephi. If you would like to explore this network graph go to the SVG view of the data. Each node is hyperlinked to its associated entity page. Hints: use the sliders to locate the graph - it is large; reduce your Browser window to 25%; use "Find in the Page" to find Entity ID numbers and use the Zoom function to move in and out. For example: A000200 is the node for the Australian Academy of Science.
Other network graph visualisations of the Encyclopedia generated from the ARDC json-ld ro-crate versions of the data can be seen in following links: 2019 December Edition - the final version of the Encyclopedia of Australian Science; 2022 March Edition - the first version of the Encyclopedia of Australian Science and Innovation. These graphs are unfiltered and show both the content and curation metadata which adds to the complexity and density but also reveals things about the evolution and curatorial history of the data. These graphs have been supplied courtesy of Daniel Russo-Batterham of the Melbourne Digital Analytics Platform at University of Melbourne.